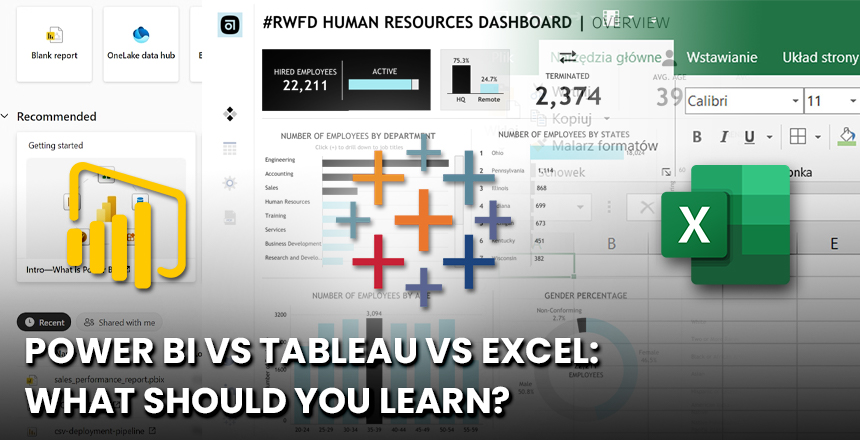
In the modern data-driven environment, data analytics, visualization, and presentation remain one of the highly desirable career assets. As long as you are a student, business analyst or working professional, the right data tool can open new opportunities once you learn how to use it. Some of the widely-used products within the given space are Power BI, Tableau and Excel, with all of them having a strong set of capabilities and yet being targeted at various use cases.
Which one is then to be learnt? It will all depend on what you need and want, what you are going to do with data, and what are your technical qualifications. This blog tears down the pros and cons of each of the tools to ensure that you make the correct decision.
Origin of data analysis through Microsoft excel
Excel is the most popular spreadsheet in the world and there is a good reason why this is so. It is convenient, multifunctional, and perfect to apply among first-time users of data technology. Starting with basic operations and proceeding with such tools as VLOOKUP, pivot tables, and conditional formatting, Excel provides a wide variety of instruments that could be used to analyze data.
The Reasons Why Learn Excel.
- Universality: Nearly all organizations utilize Excel in one aspect of their data activities.
- Easy to start: No programming necessary and user-friendly.
- Good on Small Datasets: Suitable on small-middle sized datasets and fast reports.
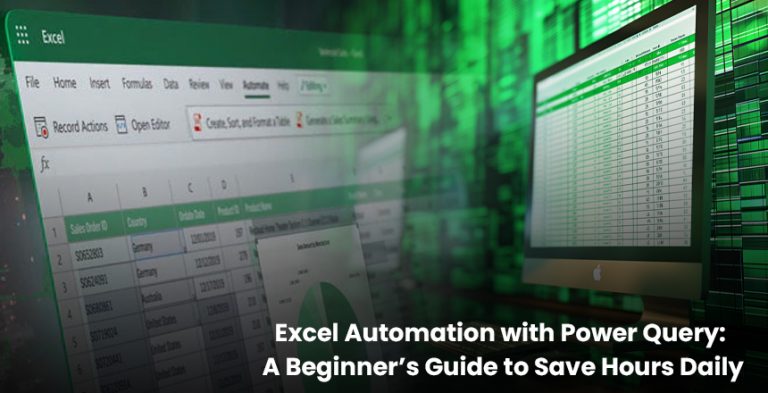
- Advanced Options: Automation with Power Query, macros, and VBA provide a chance to automate and embrace additional analysis.
Limitations:
- Lower in Large Datasets: It is slower with complicated or huge data.
- Limited Visualization: You can only get basic visualization but very much like computational solutions, which are not interactive like BI tools.
- To whom should one learn Excel: students, finance specialists, human resource managers, data analysis novices, and individuals who require daily reporting.
Power BI: The Business Intelligence of Microsoft
Power BI is a recent business intelligence (BI) solution of Microsoft which enables you to generate interacting dashboards and detailed data visualizations. It links to various data collections- excel files, databases, cloud services and shapes data into insight that can be shared.
- The question as to why to be proficient in Power BI requires some answers.
- Interactive Dashboards: Design aesthetic, real-time dashboards and use filters, slicers, and drill down functionality.
- Easy Integration: Integrates perfectly with Excel as well as other Microsoft Office tools such as Azure and SharePoint.
- Data Modeling: In DAX (Data Analysis Expressions), you are able to construct sophisticated measures and KPI.
- Affordability: has a free desktop edition and Pro functions are affordable.
Limitations:
- Learning Curve: The learning is mildly steep, more than excel, especially when DAX and relationship are in the picture.
- Microsoft Ecosystem: This will work best when your organization operates using Microsoft applications.
- Who is to learn it: Business analysts, data analysts, data finance professionals and anyone operating in a Microsoft environment, trying to get a step up on Excel.
Tableau: A Visual StoryTeller
Tableau is famous for its powerful visuals and translating the raw data into awesome, live dashboards. It has come into popular use in the enterprise environment and is appreciated by designers and people who like to go into the details of analytics.
5 reasons to learn Tableau Why learn Tableau?
- Better visualization: Enables a large number of chart types, colors, and styles in order to have a strong data story.
- Drag-and-Drop Interface: Users can create dashboards without the help of any code.
- Data Blending: allowing easy consolidation of data sources which may or may not correlate.
- Real-Time Analytics: This is awesome in processing live data and when data is produced in large quantities.
Limitations:
- Price: Expensive as well compared to Power BI, particularly when used by enterprises.
- Advanced Tasks: May need R, Python or SQL, to support more extensive analytics.
- Tableau users: Data scientists, people who work in business intelligence and researcher-type people, and individuals in visualization-intensive surroundings.
Power BI vs Tableau vs Excel: A Quick Comparison
| Feature | Excel | Power BI | Tableau |
| Ease of Use | Beginner-friendly | Intermediate | Intermediate |
| Best For | Daily reports, spreadsheets | Dashboards, KPI tracking | Data storytelling, visuals |
| Data Volume | Small to Medium | Medium to Large | Large and complex datasets |
| Custom Visuals | Basic | Good | Excellent |
| Cost | Low (MS Office) | Free (Desktop), Paid (Pro) | Paid (higher cost) |
| Integration | Strong with Office tools | Strong in Microsoft stack | Wide data source support |
| Learning Curve | Low | Medium | Medium |
What Tool to study first?
Excel is the rule of thumb, so be sure to start with it as a beginner as it will get you acquainted with different data structures, formulas, and elementary analytics. Just when you feel comfortable, a new step towards Power BI is quite natural, in the case when you build your work in a Microsoft-dominated workplace. In case you are interested in data visualization, storytelling, or need to work with the complicated data that consists of multiple sources, Tableau is a great option.
As a matter of fact, most professionals get acquainted with all three depending on the need of a given project. The combination of a good knowledge of excel with either power BI or tableau allows you to have a strong competitor position in the job market.
In Conclusion: Decide what is Best by Your Targets
Every program, such as Excel, Power BI, and Tableau, has its strong suit. The approach, which should be taken, is deciding on which tool to use rather than which tool is best. It does not matter whether you are presenting dashboards to clients, analysing trends, or working with reports, knowledge about how to work with data effectively is the true game changer.
In the d-cade of data, even the one mastered of these tools can provide a company with groundless career opportunities. Make your choices carefully, practice, practice and learn.

Take a look at how IFDA helps you to have a great career by delivering the best content and practice.