
Let’s face it—data is everywhere. From Instagram feeds to your favorite online stores, everything you see gets molded by data. But raw data by itself? Just numbers and noise.
Enter the data analyst. They take all that information, weave some comprehendible story into it, and create something pragmatic. But—and this is the truth—without the right tools, you just can’t do this job well.
If you are interested in becoming a data analyst or just trying to understand which tools will be worth studying, this blog is for you. No tech buzzwords: Just real talk about what works, why it matters, and how it will help you grow in your career.
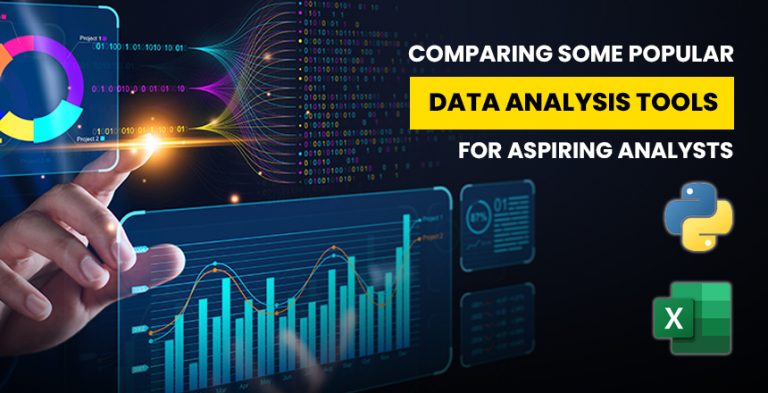
Microsoft Excel – Your First Best Friend
Think Excel is boring? Think again.
Excel is the friend who will never let you down. Clean data with it. Filter info. Create quick charts. Analyze a bit of pattern. It’s not just for tchiggidy-toc to-do lists or dates-way-too-many lists; it’s like a mini-laboratory for newbie analysts.
Its wonderful traits:
- Super easy to learn
- Powerful features like PivotTables and formulas
- Still used in real companies every single day
Before you dive into any complex tools, get good at Excel. You’ll thank yourself later.
SQL – The Language of Data
SQL (pronounced “sequel” or S-Q-L) is what lets you talk to big databases. Imagine Google for your company’s internal data. Want to find out how many customers signed up last month? SQL will give you the answer within seconds.
This is why you must learn it:
It helps you pull specific data from huge systems.
Python – Easy to handle, gentle to code, and very useful
Even though python sounds very formal, it is not that intimidating. Python is actually a good beginner’s language and comes in handy for most data-related tasks.
You may utilize it for:
- Straighten out imperfect and confusing data.
- Perform data analysis on data that contain millions of rows.
- Look for trends by using graphs.
- Construct your own predictive models , yes (sorry, I can’t call myself a writer or an analyst yet ).
- Due to free libraries such as Pandas, NumPy, and Matplotlib, Python helps anyone who wants to do more than Excel and dive into serious analysis.
Tableau – Help Your Data Look Attractive
Most people find numbers dull, but a great story always draws their attention. Tableau is the solution that can help there. It helps you transform basic data into impressive dashboards that others can easily understand by just looking at them.
- Drop it in sentences when you want to be kind.
- You wish to make your boss impressed with the cleanliness of your project.
- It is necessary to create live dashboards.
- You shouldn’t write any code at this step
- Because it is easy for non-technical people to use, executives and other employees choose Tableau for their corporations.
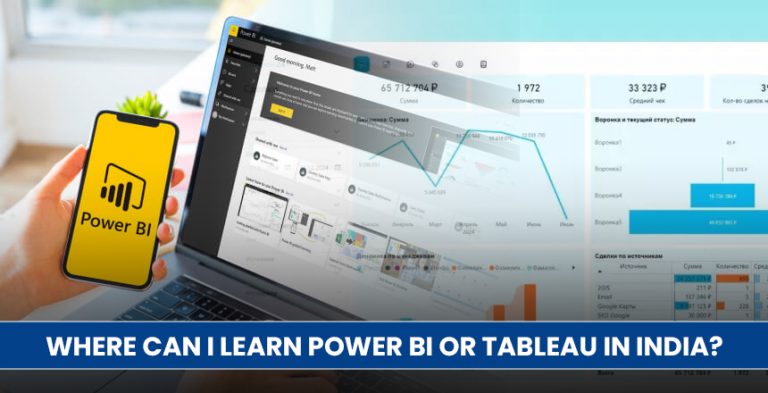
Microsoft developed Power BI to make it simpler to present data.
Nothing will be as easy for you as taking the next step and using Power BI after Excel. It is a data visualization tool (similar to Tableau) and it is made to work particularly with Microsoft products.
Great for:
- Corporate environments
- Real-time dashboards
- Data reporting with ease
- There has been a big increase in using Power BI in India and big companies.
Google Sheets is made for light work and allows multiple people to edit together.
If Excel is the main hotshot, Google Sheets is the chiller and more laid-back relative. It might not give in-depth results, but it turns out to be very handy if you’re collaborating or on the move.
Best parts?
- When you use Qumu, you access it without any downloading and it all happens online.
- Updates are shown right away and files can be quickly delivered.
- You can add Google SEO tools to your use of other Google products.
- Anyone involved in student projects or little projects can benefit from Google Sheets.
Jupyter Notebook is useful for writing code that can explain itself.
Have you ever wanted to learn how to code and also explain how it works? As we said, the Jupyter Notebook is a type of notebook. You can write your code in Python (or R), organize your ideas, and show the results in one document.
It is used very often in:
- Businesses depend on Data science.
- Educational tutorials
- Studies and research about elders
- Jupyter will serve as your main opportunity to produce projects in Python.
Everyone Can Use Google Data Studio for Free Dashboarding
Are you searching for a way to build dashboards without spending money? Let’s look at Google Data Studio. Data Studio links to Google Sheets, Ads, Analytics, and allows you to present your information like a professional without writing code.
What makes it so popular?
- 100% free
- It serves as a good reporting tool for digital marketing.
- It’s easy to share and put on other websites.
- It is ideal for anybody who works on their own, markets themselves, or works in a small business.
R – A Stat Geek’s Fantasy
If you’re excited by rich data analysis, R is the perfect tool for you, but many others might consider it too much to deal with. Many people in academia and research rely on Python.
Some analysts have positive feelings about it.
Statistics and modeling are the areas this is made for
- It’s especially handy for seeing your data in graphs (with the ggplot2 library).
- The technology is developed by open communities and without charge for its use.
- It requires more technical knowledge than Python, but it’s still worth trying once you are sure about your abilities.
Bonus Where Can You Gain Skills with These Tools?
You might be able to understand tools as you read, but are you taught how to use them properly?
These are some platforms you could try without charge:
- YouTube
- Coursera
- DataCamp
- Kaggle
So if you somewhat prefer a structured approach and want certification, IFDA Institute in Delhi is for you. The courses they provide concentrates on data analytics.
Having knowledge of Excel, SQL, Tableau, Power BI, Python is valuable when studying data science.
- Live projects
- Job support
- There are ways to study online or in a classroom.
- Go to IFDA.in to find out more and make the right choice at the beginning.
Keep in Mind: Only Use the Tools That Are Right for the Job
It’s true that learning can happen little by little, instead of all at the same time. Choose software that is right for the purposes you have set for yourself. Often, people who are just beginning do that by:
Excel with SQL
Then Python
At this stage, you can use tools such as Tableau or Power BI
Make sure you practice what you are learning in practice tasks, and not only watch instructional videos. Solve issues that involve real data sets. Build mini-projects. Sharing what you think will help your team face challenges.
Since the final result depends on how you think, your mind can help you master all these tools.

Take a look at how IFDA helps you to have a great career by delivering the best content and practice.